Rice Purity Test Score Chart: Understanding Scores From 0 to 100

You finish the quiz, see a number on the screen, and immediately wonder: Okay, but what does my score actually mean?
That is where a Rice Purity Test Score Chart can help. The basic idea is simple: scores run from 0 to 100. A higher score generally means you checked fewer experiences on the 100-item checklist, while a lower score means you checked more. Each checked item reduces the starting score of 100 by one point.
What the number does not do is tell you whether you’re a good or bad person, how mature you are, or whether your experiences were right or wrong.
Think of the score as a quick summary of your answers—not a grade on your life.
Below, I’ll break down the full scale in an easy-to-read way, explain how the ranges work, and show you what you can and can’t reasonably learn from your result.
How the Rice Purity Test Score Chart Works
The standard scoring system starts at 100.
For every item you check as an experience that applies to you, one point comes off your score.
The basic calculation looks like this:
Rice Purity Score = 100 − Number of Checked Items
So, for example:
- If you check 10 items, your score is 90.
- If you check 25 items, your score is 75.
- If you check 50 items, your score is 50.
- If you check 80 items, your score is 20.
This simple setup is why the Rice Purity Test Score Chart is easy to understand once you know what direction the scale runs.
Higher numbers mean fewer listed experiences were checked. Lower numbers mean more of them were checked.
That’s really the most important thing to remember.
A score of 90 isn’t automatically “better” than 60, and 30 isn’t automatically “worse” than 70. The numbers describe how many items on one particular checklist apply to you.
Rice Purity Score Range Chart From 0 to 100
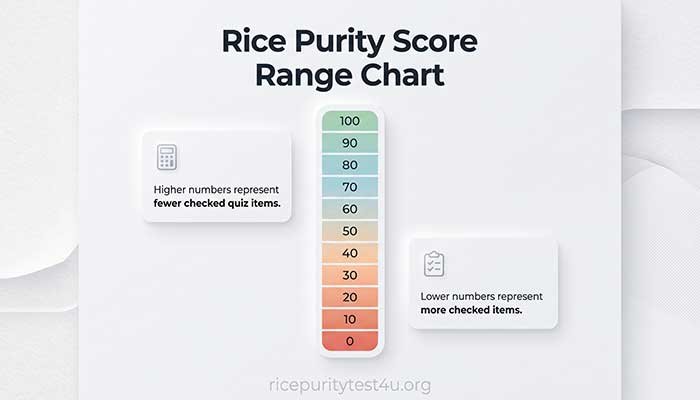
There is no universal scientific system dividing Rice Purity scores into official personality categories. For that reason, I prefer using broad descriptive ranges rather than giving each score a dramatic label.
Here is a practical Rice Purity Score Range Chart for understanding where a result sits on the scale:
| Score Range | Simple Interpretation |
|---|---|
| 90–100 | Very few listed experiences checked |
| 80–89 | Relatively few experiences checked |
| 70–79 | Some experiences checked |
| 60–69 | A moderate portion of the list checked |
| 50–59 | Around half or somewhat less of the list left unchecked |
| 40–49 | More than half of the experiences checked |
| 30–39 | Many experiences checked |
| 20–29 | A large portion of the list checked |
| 10–19 | Most listed experiences checked |
| 0–9 | Nearly all or all listed experiences checked |
These ranges are best used as convenient reading guides. They are not official classifications, percentiles, diagnoses, or measurements of someone’s character.
Two people can even have exactly the same score while checking completely different questions.
That’s one reason I wouldn’t read too much into a number by itself.
Read More: What Is A Good Rice Purity Score?
Rice Purity Test Score Ranges Explained
Let’s look more closely at different parts of the scale.
Scores From 90 to 100
A score between 90 and 100 means relatively few items on the checklist were checked.
A score of 100 sits at the very top of the scale and means zero items were checked. A score of 90 means 10 were checked.
Someone landing here may simply have fewer of the experiences listed in the quiz.
That’s all the result can safely tell you.
Age, preferences, opportunities, boundaries, relationships, and countless personal circumstances can affect which experiences someone has had. The score doesn’t explain any of that context.
Scores From 80 to 89
The 80s still sit toward the higher end of the Rice Purity Test Score Chart.
For example, a score of 85 means 15 items were checked.
Friends sometimes compare scores and assume a difference of five or ten points must mean two people live completely different lives. That’s not necessarily true.
Remember that the total doesn’t show which items created those points.
Two people scoring 85 could have very different answer patterns.
Scores From 70 to 79
Scores in the 70s mean roughly 21 to 30 of the 100 listed experiences were checked.
This part of the scale can be especially interesting in a group because people with similar totals may have reached them through completely different experiences.
Does this sound familiar? You and a friend reveal nearly identical scores, then realize your answers don’t match nearly as closely as you expected.
That’s why the conversation around a score can sometimes be more entertaining than the number itself—as long as everyone is comfortable sharing.
Scores From 60 to 69
A result in the 60s means 31 to 40 checklist items were selected.
For example:
Score 65 = 35 checked items
Again, the math is useful. Trying to attach a personality type to that number isn’t.
You might see websites or social posts describe particular ranges with labels such as “innocent,” “experienced,” or something more dramatic. Those descriptions are usually informal interpretations rather than objective categories.
I think simple descriptions are more useful because they leave the personal judgment out of it.
Scores From 50 to 59
Scores in the 50s sit near the numerical middle of the 0-to-100 scale.
A score of 50 means exactly 50 items were checked.
That doesn’t mean someone is “average.” The middle of the numerical scale and the average score among real people are two different things.
Reliable population comparisons would require good data about who took the test, how participants were selected, and which version they completed. Without that information, treating 50—or any other score—as a universal average can be misleading.
Scores From 40 to 49
A result in the 40s means more than half of the checklist applies based on the answers given.
For instance:
Score 45 = 55 checked items
At this point, the same rule still applies: your total tells you the number of checked items, but not the story behind them.
The quiz also cannot tell whether an experience happened once or many times. One checked box has the same effect on the score either way.
That’s an easy detail to overlook when comparing results.
Scores From 30 to 39
A score in the 30s means 61 to 70 experiences were checked.
You may see stronger reactions when friends compare scores in this range, especially if the numbers are far apart.
Keep it light.
Nobody owes the group an explanation for their answers. Sharing the final score can be fun without turning the quiz into an interview about private experiences.
That approach works especially well for college friends and couples who want to enjoy the test without making anyone uncomfortable.
Scores From 20 to 29
Scores in the 20s indicate that a large portion of the checklist was checked.
For example:
Score 25 = 75 checked items
It may be tempting to create a detailed story about someone’s life from that number, but the score doesn’t provide enough information to do that.
It simply reflects responses to the specific experiences included in the quiz.
Scores From 10 to 19
A score between 10 and 19 means most items on the checklist were checked.
A score of 15, for example, corresponds to 85 checked items.
That’s a clear mathematical interpretation.
Anything beyond that requires context the number itself doesn’t provide.
This distinction matters because Rice Purity scores often get shared without the actual answers. Once the individual responses disappear, much of the context disappears with them.
Scores From 0 to 9
This is the lowest end of the Rice Purity Test Results Chart.
A score of 5 means 95 items were checked, while a score of 0 means all 100 were checked.
That doesn’t make the result a moral rating, warning sign, or personality assessment.
It is still just a checklist total.
If you’re using the quiz with friends or a partner, treating unusual or surprising scores with curiosity rather than judgment usually keeps the experience much more fun.
What Does a Score From 0 to 100 Mean?
The simplest score 0 to 100 meaning is mathematical.
Your score shows how many points remained after subtracting the experiences you checked.
At the two extremes:
100 = 0 checked items
0 = 100 checked items
Everything else falls between those points.
That also means you can instantly work backward from any result.
If someone scores 72:
100 − 72 = 28 checked items
If someone scores 43:
100 − 43 = 57 checked items
This is much more reliable than trying to assign personality traits to arbitrary score bands.
Why Two People With the Same Score Can Be Very Different

This is one of the most useful things to understand about a Rice Purity Score Guide.
The total doesn’t identify individual answers.
Imagine two friends both score 80. Each checked 20 items, but Friend A and Friend B might have checked different experiences.
Their final numbers would still match.
The test also doesn’t measure the circumstances surrounding those answers. It doesn’t tell you why something happened, when it happened, how someone felt about it, or whether an experience happened once or repeatedly.
So while score comparison can be entertaining, the number is a very compressed summary.
Don’t confuse it with someone’s full story.
Should You Compare Rice Purity Test Scores?
You certainly can if everyone involved wants to.
Comparing scores is one reason the quiz can be fun with college friends, couples, or a close group. Someone gets 84, someone gets 63, and suddenly everyone is curious about the difference.
Just keep privacy in the picture.
You can share:
- Only your final score.
- A general score range.
- Specific answers you’re comfortable discussing.
- Nothing at all.
There is no requirement to explain your result.
For couples, score differences can also become conversation starters. But the numbers shouldn’t be treated as proof that two people are compatible or incompatible.
They’re quiz results, not relationship evaluations.
Is a High or Low Rice Purity Score Better?
Neither score direction is automatically better.
A high score means fewer experiences from the checklist were selected. A low score means more were selected.
That’s the factual difference.
Calling one result “good” and another “bad” adds a judgment that the test itself can’t support.
Your result doesn’t determine your character, maturity, health, intelligence, relationships, or worth.
If you’re taking the quiz for fun, my preferred approach is simple: read the score, understand the math, laugh about any surprises you’re comfortable sharing, and move on.
How to Use This Rice Purity Test Score Chart
The easiest way to use the chart is to first find your score range and then work out exactly how many items you checked.
Use this formula:
Checked Items = 100 − Your Score
Then treat the broader score range as a quick reference point rather than a strict category.
For example, if you receive 76:
- Your score is 76.
- You checked 24 items.
- You fall within the 70–79 descriptive range.
- The result tells you nothing definitive about your personality or life beyond those selected checklist items.
That’s about as much meaning as the number can reliably provide.
Final Thoughts on Rice Purity Test Scores
A Rice Purity Test Score Chart makes the 0-to-100 scoring system much easier to understand.
Higher scores represent fewer checked experiences. Lower scores represent more. Every point reflects one item on the 100-question checklist.
The useful part ends there.
There isn’t a magic number that proves someone is innocent, experienced, mature, immature, compatible, or anything else. Your score is simply a compact summary of how you answered a fun self-reflection quiz.
Compare results if you enjoy it. Talk about answers if everyone feels comfortable. Keep private answers private if you’d rather not share them.
Most importantly, don’t turn a fun number into a judgment about yourself or somebody else.
FAQs:
CTA: Curious where you land on the 0-to-100 scale? Keep it fun, answer at your own comfort level, and see your result.